DATA ANALYSIS SERVICES
Data-to-Dashboard Development
Our start-to-finish pipeline transforms raw ocean data into organized, code-driven products and interactive dashboards for exploration and decision-making.
Analytical Workflow
Data Processing & Dashboard Delivery
Step 1
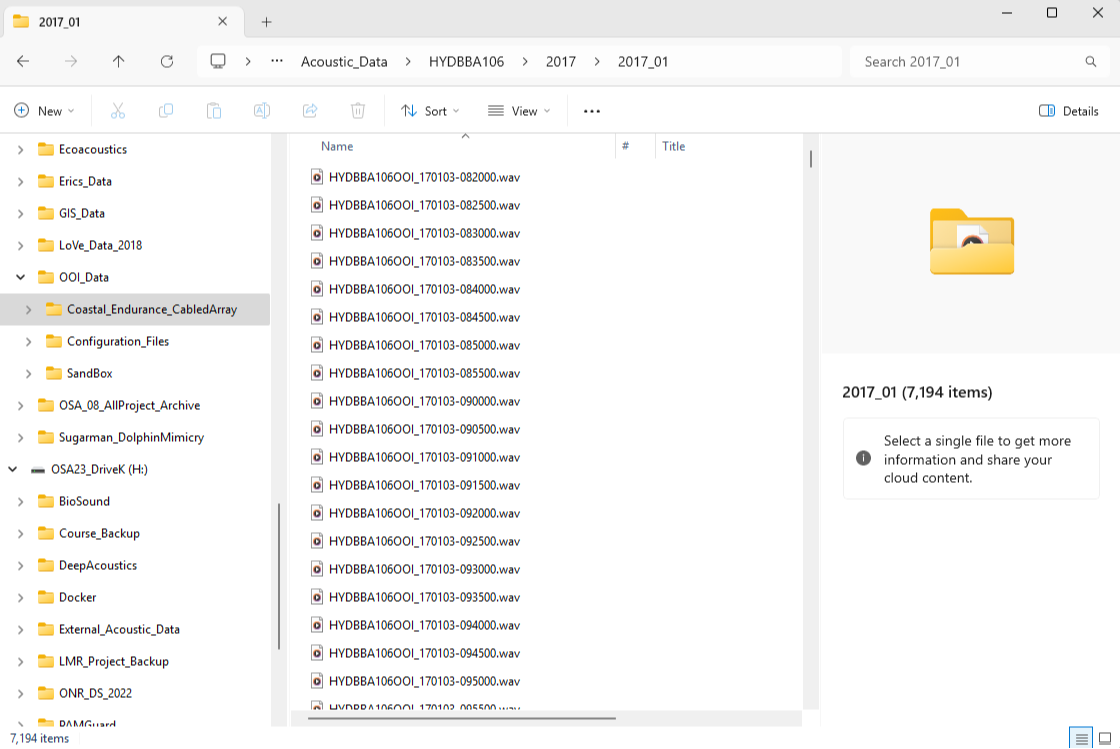
Data Organization & Product Derivation
Raw ocean data—such as audio files, satellite variables, or oceanographic sensor streams—are cleaned, standardized, and used to generate intermediate products like detections, indices, or derived metrics.
Step 2
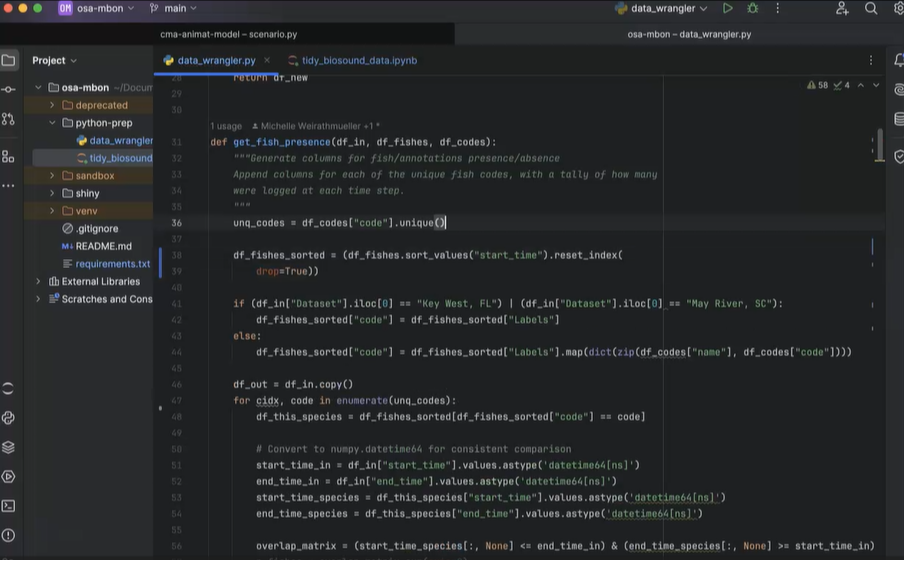
Programmatic Structuring & Alignment
Using custom code, intermediate data are temporally and spatially aligned, formatted, and staged for use. This step prepares the dataset for visualization and user interaction across platforms.
Step 3
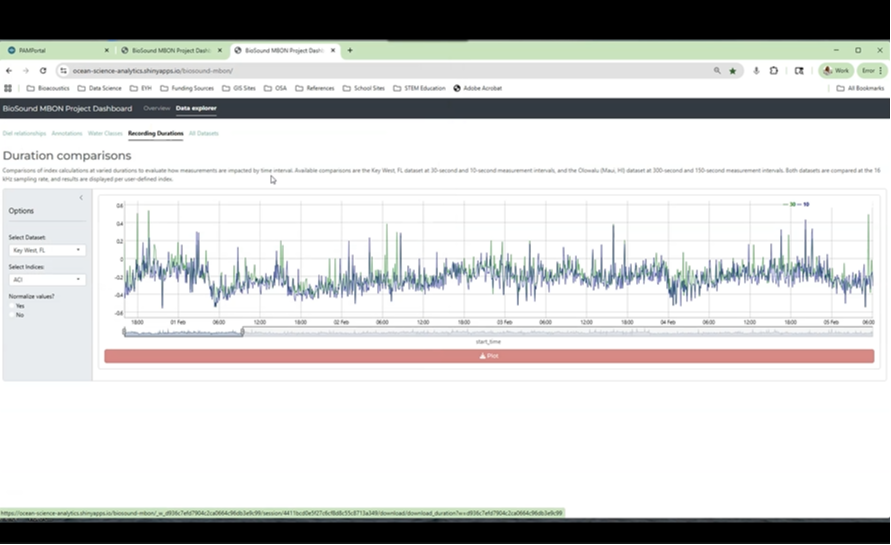
Custom Feature Development
Interactive components—such as filtering, highlighting, or multi-variable comparisons—are built into the framework, tailored to the needs of specific data types and user workflows.
Step 4
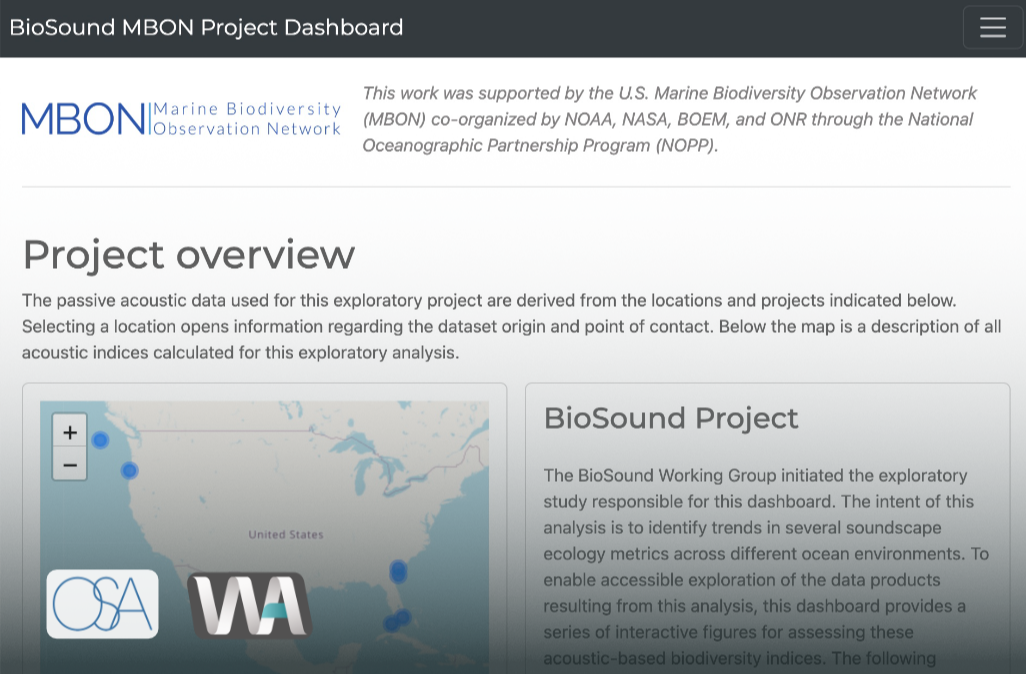
Dashboard Integration & Delivery
Final outputs are delivered through a user-friendly web dashboard, allowing end users to explore, interpret, and share ocean data products with clarity and control.
Waveform Analytics
Waveform Analytics is our key strategic partner for building interactive, user-centered dashboards that translate complex ocean data into accessible, decision-support tools. Their expertise in custom analytics and data visualization helps power our end-to-end data-to-dashboard services.

CUSTOM DATA DASHBOARDS
Flexible Solutions for
Any Ocean Dataset
Whether you’re working with passive acoustic recordings, satellite observations, biological surveys, or in-situ oceanographic sensor data, we tailor our workflow to meet your needs—from raw input to interactive dashboard. Our modular approach ensures that no matter the data type or format, we deliver structured, visual, and accessible outputs that support informed decision-making.
CONTACT US TODAY